Improving Hotspot
Embold helps to analyze your data. There are a few ways through which hotspot can be improved:
Analysing the component rating
In Identifying Problems, the selected component could be problematic and requires further investigation. Navigate to this component by selecting the first snapshot in the dropdown is selected, and then use the component list or the heatmap to navigate to this component.
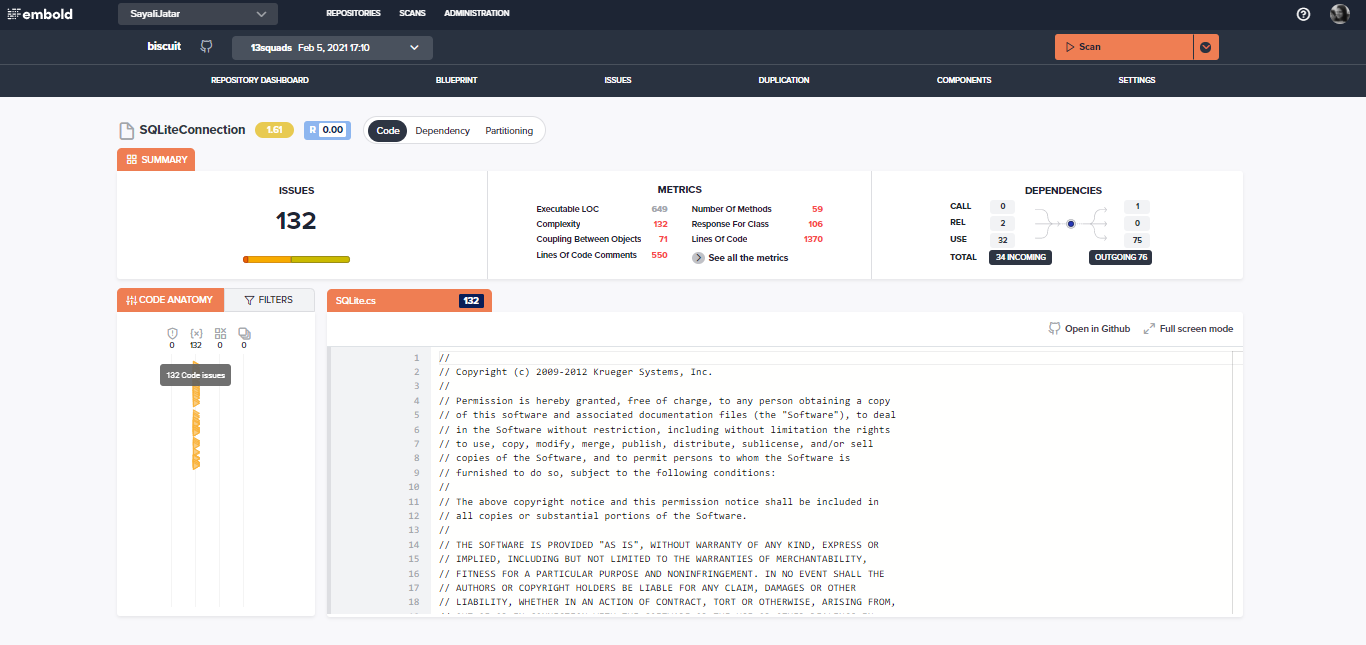
Besides the component name, the Embold overall rating along with the risk score scores is displayed at the top. Additional information is displayed when you hover over these ratings.
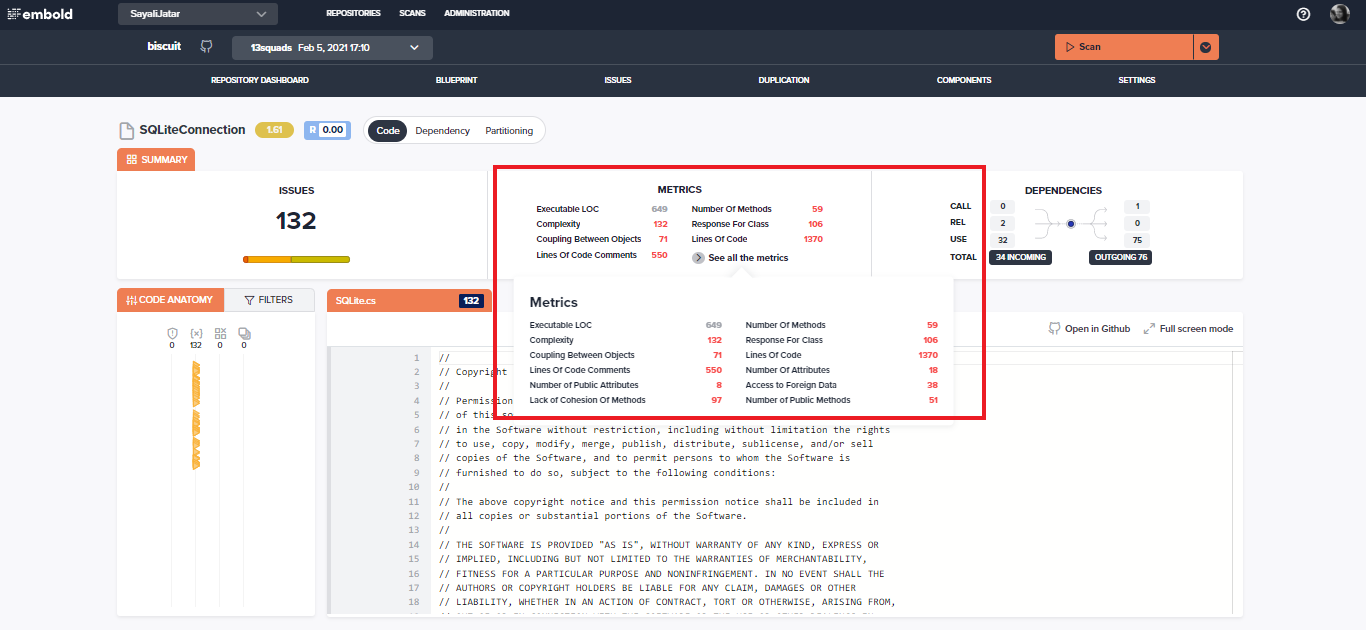
Hovering over the “See all the metrics” text opens up the actual metric values for this component. The red values indicate that a metric has exceeded our threshold and is thus considered sub-optimal. Find out more about our metrics and their thresholds on our documentation.
Investigating problematic areas of the code
Below is a view of the source code for this specific component. The code itself is displayed on the right side, whereas all code specific findings are on the left side. There are different types of findings like:
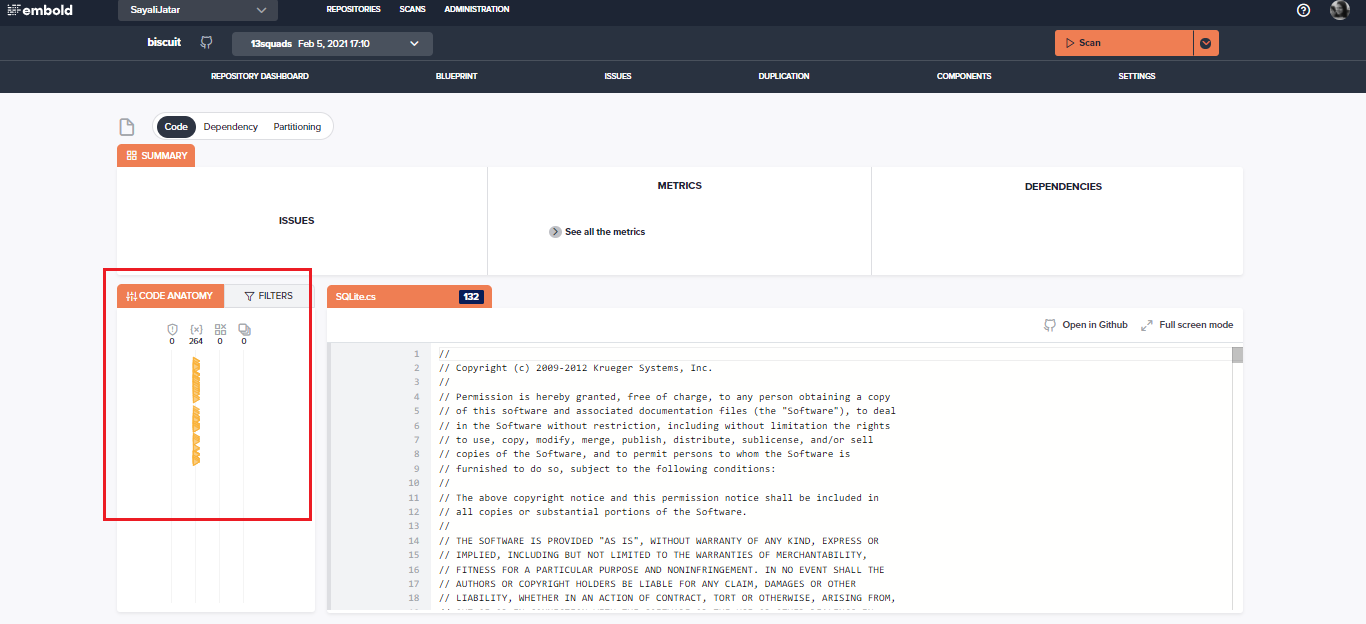
The line number is displayed on the left side when the user clicks under “Code Anatomy” for any of the types and hovers from top to bottom. He will be redirected to that specific line number on the code view right-side panel when he clicks on that section.
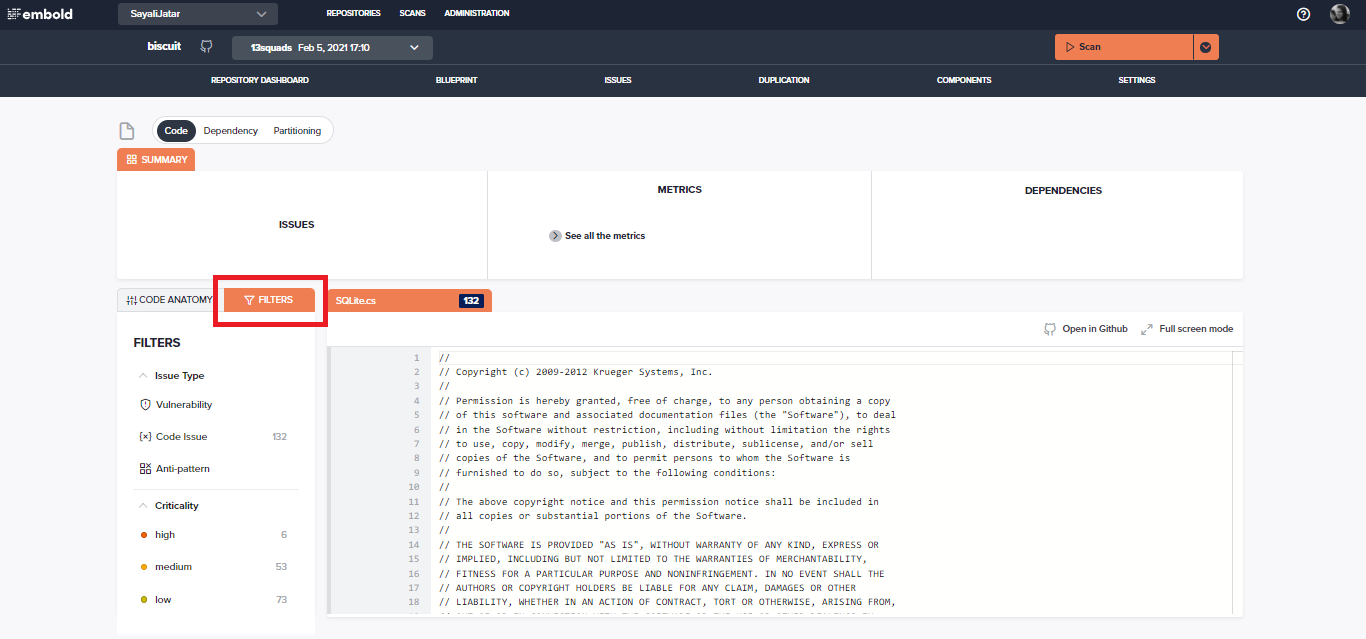
Next to the code anatomy tab, the “Filters”tab is displayed. Click on the Filters tab to check for more filtered information.
Analyse dependencies
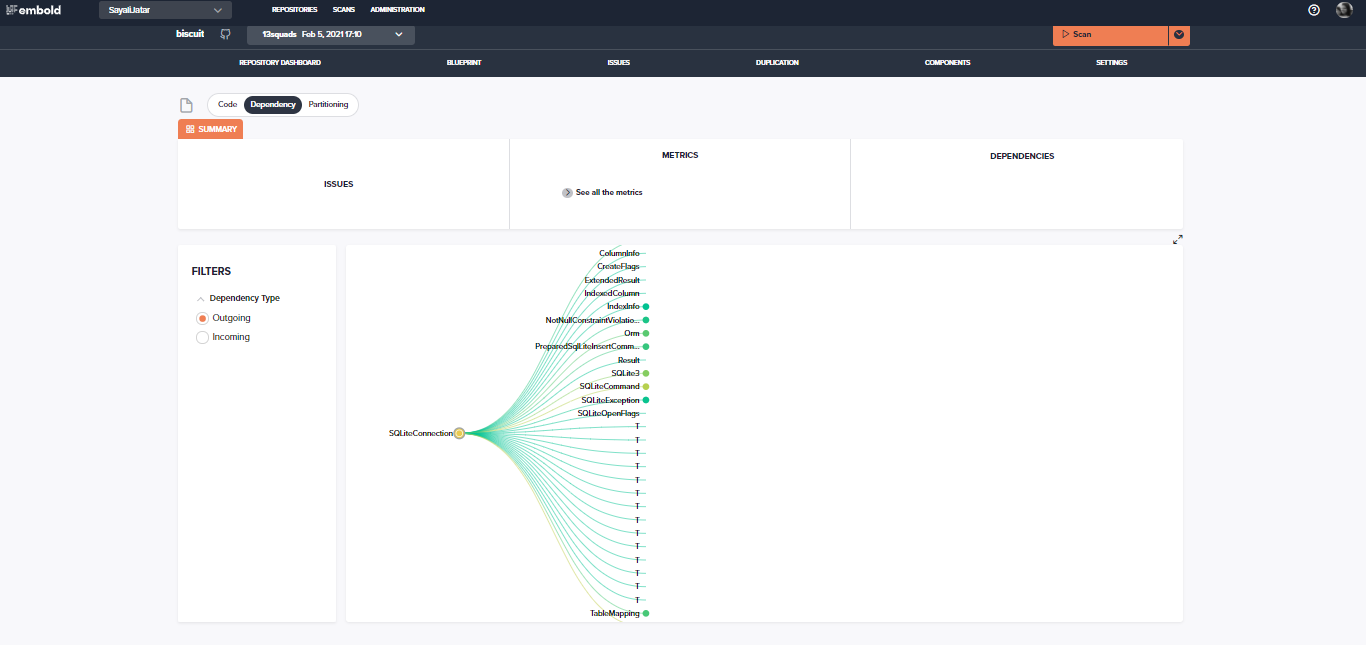
After navigating to the Component Explorer of a certain component, the Dependency View can be accessed by entering into that specific component:
The Dependency View can show all incoming or outgoing dependencies of one component. Outgoing dependencies are describing the components that are used by the current component, incoming dependencies show which other components use the current component. The colour of the connecting line between two components indicates the respective rating of a connected component.
To view multiple levels of dependencies, can click the little circles after each component name. This can especially be useful when analyzing a dependency-based anti-pattern such as Global/local Butterflies or global/local Breakables.
Using the Partitioning Editor
When to use the partitioning editor?
There are many issues that are a result of classes being too large. This can range from components that are slightly above the recommended lines of code threshold to large components with non–cohesive functionality.
A common strategy for dealing with such components is breaking them up into multiple smaller components. This way, each component is providing a clean abstraction and cohesive functionality. Unfortunately, doing this kind of refactoring can be quite complicated, especially when dealing with very large classes. The Partitioning Editor is intended to make this kind of refactoring work more efficient.
How to use the partitioning editor?
After navigating to the Component Explorer of a certain component, the Partitioning View can be accessed by entering into that specific component.
Based on a partitioning algorithm and language processing, it recommends a way to split up the current component into multiple smaller components. With the range input on the top, the granularity of the partitioning algorithm can be defined. The higher the range, the finer the recommended partitioning.
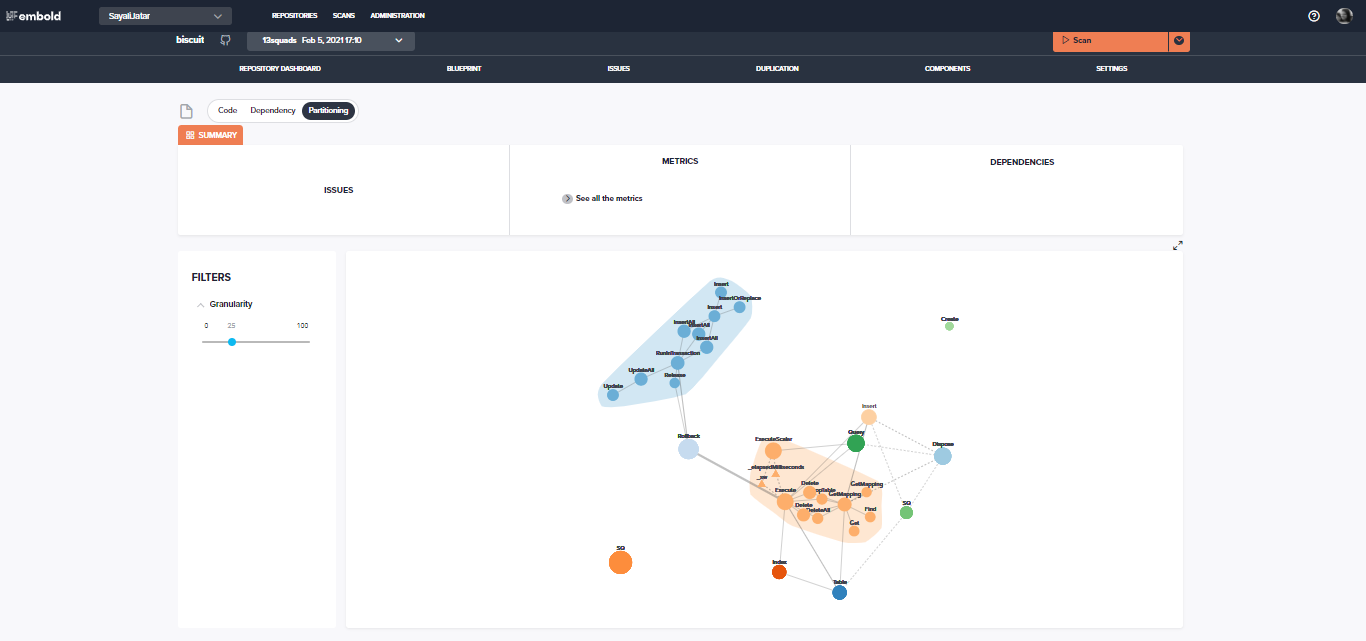
The screenshot above shows one sample partitioning. It shows that it is possible to split this component into smaller components as well as a few minor ones. When clicking on one of the bubbles, it shows which attributes and methods of the component are suggested to be put into that partition
Updated about 1 year ago
